Happy new year! And don’t the Liberal Democrats know how to celebrate, with a widely reported press release calling the number of empty homes in the UK a “scandal”.
Now, I’m not party political in this blog. Yes, I spend a fair amount of time critiquing the government, but that is because they are the government. They are the ones able to see their policies come to fruition on a national scale, so it shouldn’t be too surprising that I want to look at that. But something caught my eye in the Lib Dem release, something that gets my goat every time I see it, no matter which organisation it comes from.
Let’s get on the same page first- using some simple language. Empty homes aren’t great and bringing them back into use is a good thing. I don’t disagree with the main conclusion of the release, that Councils need further powers to bring empty homes -the vast majority of which are privately held- back into use. However, when you actually dig into the data, there is some richness that has been missed and indeed some uncomfortable truths about where empty homes are that means policy directed only at solving this may not be completely successful.
Others have quite rightly pointed out that the numbers seem large, until you compare them with the total national housing stock, or indeed the numbers of new net homes the country actually requires. I’m not going to repeat those unnecessarily, but they are important points to make. Every single long term empty home could be brought back into use without making a really significant dent in the ongoing housing need for the country.
What I really want to talk about is the relative size of local authorities and why it makes comparing overall numbers particularly pointless. The press release goes into detail of the areas with the highest number of empty homes, citing Durham, Leeds, Bradford and Cornwall as the areas with the most empty homes. That may be true, of the places that replied. But what that doesn’t understand is that local authorities have huge differences in population and numbers of dwellings. So comparing absolutes for these areas is bound to lead to larger areas having more of a wide variety of variables.
I’ll put it another way. Let’s say I run a cat charity. I want to put out a press release saying which area is the “most cat loving”. So I write to the cat department of every local authority asking them how many homes have cats in the area. I dutifully get the answers back, put them in a spreadsheet and what do you know, the “most cat loving areas” are Birmingham, Leeds, Glasgow, Edinburgh and Liverpool. Why is that? Because they are the local authority areas with the biggest populations and number of households.
So one area has a higher number of empty homes than another, but what does that mean? Are we to expect to see more empty homes if we take a walk around the streets? Of course not, if there are 3 times the number of empty homes, but the authority is 10 times as large, then it looks to me like public policy is better focused on the smaller area.
So, in my opinion, what the authors of the press release should have done is work out the proportion of empty homes compared to the number of dwellings in the area. I don’t know why they didn’t; the figures are freely available for England, Scotland and Wales. I do know it takes about 2 hours to manually copy and paste them across into the spreadsheet, because that’s exactly what I did.
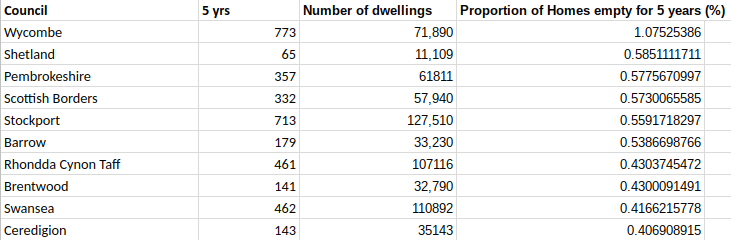
Here’s my version of the press release statistics, with sheets reordering the list of local authorities based on the proportion of vacant homes and the proportions of 5 year and 10 year vacant homes. This makes for some much more interesting and frankly depressing reading.
The 10 areas with the highest proportion of empty homes are:

And here is the proportion at 5 years:
And here it is at 10 years:
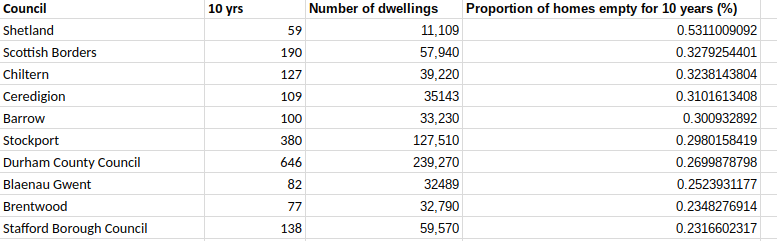
I’m not quite sure what is happening in Wycombe and Chiltern (this might be related to the law of small numbers), but the rest of the list looks somewhat familiar. All the original “big four” have dropped out apart from Durham and that looks in keeping with what could be an actual issue. Scottish, Northern, Welsh, Midlands, former strong working communities now de-industrialised, towns not cities, with relatively low house prices dominate the lists.
It is almost like the proportion of empty homes is a symptom of another problem rather than something that can be solved in isolation. So going on about empty homes in isolation might not be the best thing to do, when the issue might well be depopulation and corresponding low house prices.
The other thing to repeat is look at how small those figures are. Outside of Shetland (which will be an outlier due to its tiny overall size and living conditions) the areas with the highest proportion of empty homes after 10 years is less than one in 300. Yes, people get very upset if that one in 300 (or less) happens to be next door to them, but we do need a bit of perspective when thinking about policy.
This puts the over-simplified conclusion of the Lib Dem release under some doubt. If empty homes are a blight and a waste (and they are!) then the areas with the highest proportion of them must be the areas with the biggest proportions of blight and waste. But perhaps what is required is not just Councils taking over empty homes, but wider and more thoughtful approaches to improve the economy of those areas and give empty homeowners a reason to want to bring them back into use.
There’s a couple of other flaws with the release, the most major being that a large number of Councils aren’t included. Both Manchester and Birmingham (Councils, not the whole conurbations) manage to not be included in the release, most likely as a result of not getting the FOI response back before the Lib Dems wanted to issue it. Sure, that can only increase the overall number of empty homes, but it can change the overall proportion of homes and looking at the government’s figures suggests that Manchester especially has an interesting (and positive) story to tell about bringing empty homes back into use.
Which brings me onto the final point of concern about the release, which is the over-reliance on looking at Empty Dwelling Management Orders (EDMOs) on bringing empty homes back into use. The Lib Dems have actually asked Councils how many homes have been brought back and how many EDMOs they have used. The only thing that they have reported is the proportion of Councils using EDMOs. When you actually look at their own figures, what you see is that areas like Leeds (although be careful about proportions rather than overall numbers!) and Newcastle are bringing the most empty homes back into use and they are doing it without significant use of EDMOs!
Clearly, if the press release authors wanted to look at bringing empty homes back into use, if they really wanted to understand what worked and what didn’t then they might have asked the areas doing best what was happening. I’m sure (in fact, I know) both of the Councils in these cities have been trying very hard to bring down the numbers. But at least part of the answer might lie in the fact that both these cities have inward investment, public and private and improving economies.
Which takes us back to the earlier point- perhaps what this data is showing us is the solution to empty homes is found in improving the wider economy of de-industrialised areas, particularly towns, as well as individual measures on housing.

2 thoughts on “Empty homes, vacant stats and a bugbear”