
Has everyone seen the video of the man who uses excel to paint? Well, I can’t say I’m anywhere near as interesting as him, but I can usually hold down a spreadsheet and extract some valuable information from it.
The heart wrenching testimony from the work and pensions committee have shown, once again, that the systems looking into what benefits people with health issues receive are not working properly.
As regular readers will know, I have already shared my two pennies on one of the reasons I think employment and support allowance (ESA) and personal independence payments (PIP) appeals are going through the roof and why mandatory reconsiderations (the new-ish process the DWP is forcing on claimants) are not helpful. I’m not alone in wanting to look at this, indeed, the work and pensions committee have an ongoing investigation into PIP and ESA assessments, where that recent testimony came from. As part of this the DWP has given them some supporting statistics, which are a treasure trove of interesting information.
That said, like most treasure you do have to do some digging. I’m always very interested in looking at government responses to select committees (or, for many local authorities, scrutiny committees). If you know what to look for you can often find what information the authors are trying very, very hard to avoid saying, whilst putting the data out into the open.
And so it is with the data tables the DWP have released, alongside an explanatory document that explains far more than it is trying to let on. That said, if you read just the explanatory document you wouldn’t see much of interest. But when you actually look in detail, you can see what they are hoping you will miss.
Before we get into the data proper, let’s just take a quick step back and remind ourselves what mandatory reconsiderations are. Introduced in 2013, this was an additional step where a benefit claimant thought a decision was wrong. Instead of just being able to appeal straight away, they had to ask for the DWP to look again at the decision and then only once this was complete could they, separately, appeal against the decision.
This was controversial as it was adding another layer of decision making, expecting claimants to understand the process and to push forward through a difficult and complicated appeals process if they believed the decision was wrong. This is even more difficult when you think that simultaneous cuts to legal aid mean fewer and fewer people can be appropriately represented through the appeals process.
What I find odd about the explanatory document is that it consistently puts each statistic into the context of a larger cohort. So we don’t see just the outcomes from mandatory reconsiderations, we see that within the context of all claimants.

Similarly, we don’t see just the proportion of PIP decisions that are overturned at the first tier tribunal, we see that within the context of all mandatory reconsideration decisions.

This makes issues appear smaller than they are. Sure, lots of people are asking for mandatory reconsiderations and then appealing, but they want you to look at it in the context of the whole benefit, where other people are not asking for a reconsideration and then appealing. Surely those people are happy with their decision?
Coming from that second graph, the second odd thing I notice is the insistence that there is a small (2 percentage points) gap between different health conditions. The suggestion seems to be that conditions are treated quite similarly and have similar results.
Well, both those oddities can be rectified by having a look at the actual data. As I suggested at the start of the post, I have held the statistics down and given them a bit of a thrashing out, which is available here. The graphs that follow all come from my tables, which are themselves simply rearrangements of the DWP statistics.
So, when we look at the actual data of decision making we can see some interesting results. Firstly, and coming straight from the government’s data, we can see that a whole lot of people stop after the mandatory reconsideration stage. Nearly 450,000 claims had PIP decisions upheld by mandatory reconsideration between 2013 and July 2017. All of those could have applied for an appeal if they still disagreed, yet only 126,000 have had appeals heard. Similarly, 448,000 ESA claims were upheld at mandatory reconsideration, but only 152,700 cases were heard.
What does this mean? I suspect, particularly for the more recent decisions, appeals have been made but not yet heard; the tribunal service have a big backlog for obvious reasons. It also means mandatory reconsideration has been an exceptionally powerful tool for stopping people from appealing. It’s hard to tell why that is, perhaps some genuinely accepted the DWPs version of events? But perhaps along with this, people are giving up, or are unable to cope with the stress of further appeals or blindly accept what the DWP is telling them or, worst of all, think that the mandatory reconsideration was the appeal. Further research is most definitely required, because I don’t think society can see this as a win until we know what is really going on.
But more than that, when you look at the overall appeal outcomes, these statistics start to mirror those of the tribunal service itself. Wade through the data and this shows the DWP confirming that 62% of their PIP decisions are overturned on appeal. For ESA it is nearly 45% between 2013 and July 2017.
The ESA result sounds better, until you see that the proportion overturned has been going up each year since 2013, with the rate so far this year matching 2016/17s high point of 61%.

So whilst mandatory reconsiderations may be preventing many people from appealing, those that do appeal are winning their cases in droves. It’s just like Sir Henry Brooke said a few weeks ago.
Coming onto the second oddity from the explanatory document, this idea that diseases are treated approximately the same. That looks like it is a result of the contextualising data rather than the actual facts. Here is the chart for different primary health conditions for PIP:
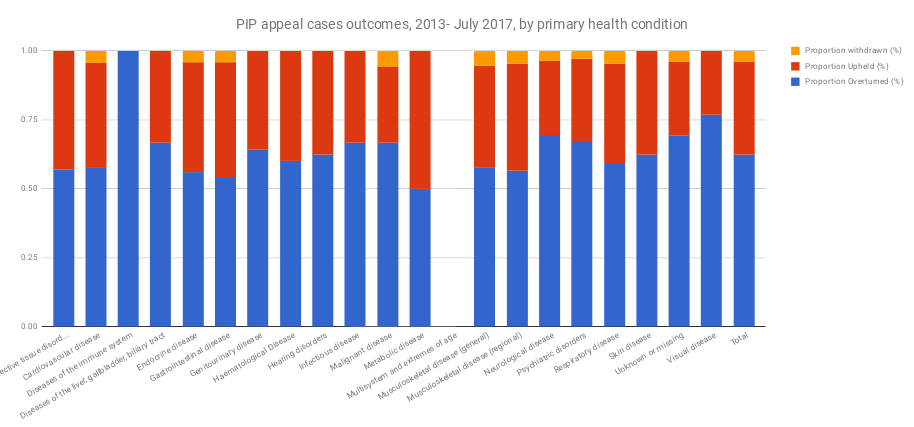
In PIP the highest areas of tribunal overturns are for immune diseases (100% of the 100 cases over those years), visual disease (77% overturns) and neurological disease (70%). The lowest is metabolic disease, with just (just!) 50% of the cases being overturned at tribunal.
And here it is for ESA: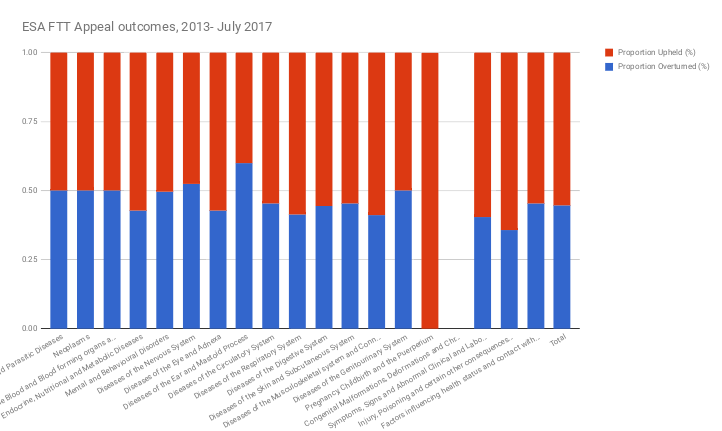
For ESA the highest proportion of successful appeals was in cases with ear and mastoid processes (60% of the admittedly small 500 cases over the period) with a wide selection of health problems getting 50% of claimants being successful in their appeals. There are so many at 50% I had to check I wasn’t using the same data twice! The lowest is childbirth and related issues with no successful cases recorded. Due to the way the DWP has collated these figures (to the nearest 100) this means a small proportion of cases could have been successful. Injury and poisoning, one of the biggest groups of people appealing decisions, has the next highest failure rate, with only (only!) 36% being successful at appeal.
Overall, if you aren’t aware of the DWPs terrible record at appeals you should be shocked by how high each and every one of these numbers is. The DWP is losing cases by the bucketload, which asks serious questions about their competence and about the process of mandatory reconsideration.
What’s more, and however they are trying to argue it, it is losing cases for some primary health conditions more than it is others, so they should be looking at this to work out what they can do to make better decisions the first (or second) time around. Finally, especially on ESA, it is losing a higher proportion of cases each year, indicating something is very wrong with its decision making.
I think the DWP is trying to say that the focus from people like myself is on a small proportion of their decisions. Those of us on the outside only think about appeal decisions and not about those people who accepted the decision, either when it was first made or after the mandatory reconsideration. But that misses the point: we don’t know why people didn’t appeal. Some might have been happy with the decision, but are others simply unable to get through the process themselves? Many of the decisions (particularly the refusals) could have been just as bad as those getting to appeal, but we simply don’t know. The heartfelt responses the work and pensions committee have received in recent weeks point to the fact that people feel let down and confused about the whole process.
This is a key issue with mandatory reconsiderations- it has added another layer in decision making. A layer suggestive of a tickbox exercise that seems to put droves of people off appealing further, even if they may well have a case on appeal. It is another piece of paper to fill in, another time you have to explain your health condition to a stranger, placing yourself emotionally on the line and another place where -as does happen- there is a chance the award can go down as well as up.
I think we can all agree mandatory reconsideration isn’t working. I don’t want to put extra work on the tribunals service, but I can’t see how the DWP can justify maintaining the current mandatory reconsideration process when their appeal outcomes are so bad. The DWP used to always reconsider their decisions after an appeal in any case, so we have to ask why this obstructive layer is allowed to remain.
PS I’m aware that the charts have some of the primary health conditions names chopped down. It is basically impossible to do it any other way when you have such big names for conditions. All of the full condition names are available on the google document containing the charts and sheets for your persual.

2 thoughts on “Numbers and numbness”